
When Seoul Was Built

This project asks a simple urban question: what does Seoul look like when building approval dates are treated as an urban timeline?
Instead of building an interactive dashboard, the project focuses on turning public building-age geometry into a readable static data story. The goal is to make Seoul's urban growth easier to scan: older cores, large redevelopment eras, newer approval patterns, and unknown-date buildings all become part of one visual layer.
GEOSPATIAL PUBLIC DATA MAPPING
Data
The project uses public Seoul building-age tile groups and a local Seoul building-footprint inventory for structural context. The local footprint inventory contains 593,625 rows across Seoul's 25 districts, but the main age map is built from public age-bucket geometry because those tiles expose the approval-year information needed for temporal mapping.
The age-layer build covers Seoul bounds from approximately 126.76 to 127.19 longitude and 37.43 to 37.70 latitude. The recorded build requested 1,312 z15 tiles for each source bucket and fetched all requested tiles with zero failed tiles.
Method
The pipeline normalizes public tile groups into one cartography-ready age layer:
- Fetch all Seoul-facing z15 tiles for each age bucket.
- Decompress and normalize GeoJSON features.
- Parse approval dates from
YYYYMMDDstrings. - Convert valid dates into approval years.
- Assign each feature to an era band.
- Group malformed or missing dates as
Unknown. - Deduplicate features and export processed age layers for rendering.
The current era bins are: Before 1960, 1960s, 1970s, 1980s, 1990s, 2000s, 2010-2016, and Unknown.
Visual Overview
The preview summarizes the processed layer as a compact visual explanation: key build statistics, approval-era counts, and an abstract city-block view of the same temporal idea. Warmer colors represent older approval eras, cooler colors represent newer eras, and grey marks buildings without usable approval dates.
The result is not just a decorative visual. It is a compact analytical layer: the color distribution makes the city readable as overlapping generations of construction.
Map
The main output is a static citywide map of Seoul's building approval eras. Each mapped building footprint is colored by its approval-year band, while invalid or missing approval dates are grouped as Unknown. The dark background makes the footprint layer read like an urban fabric, so rivers, mountain gaps, roads, dense redevelopment zones, and older neighborhood cores become visible through the absence or concentration of colored buildings.
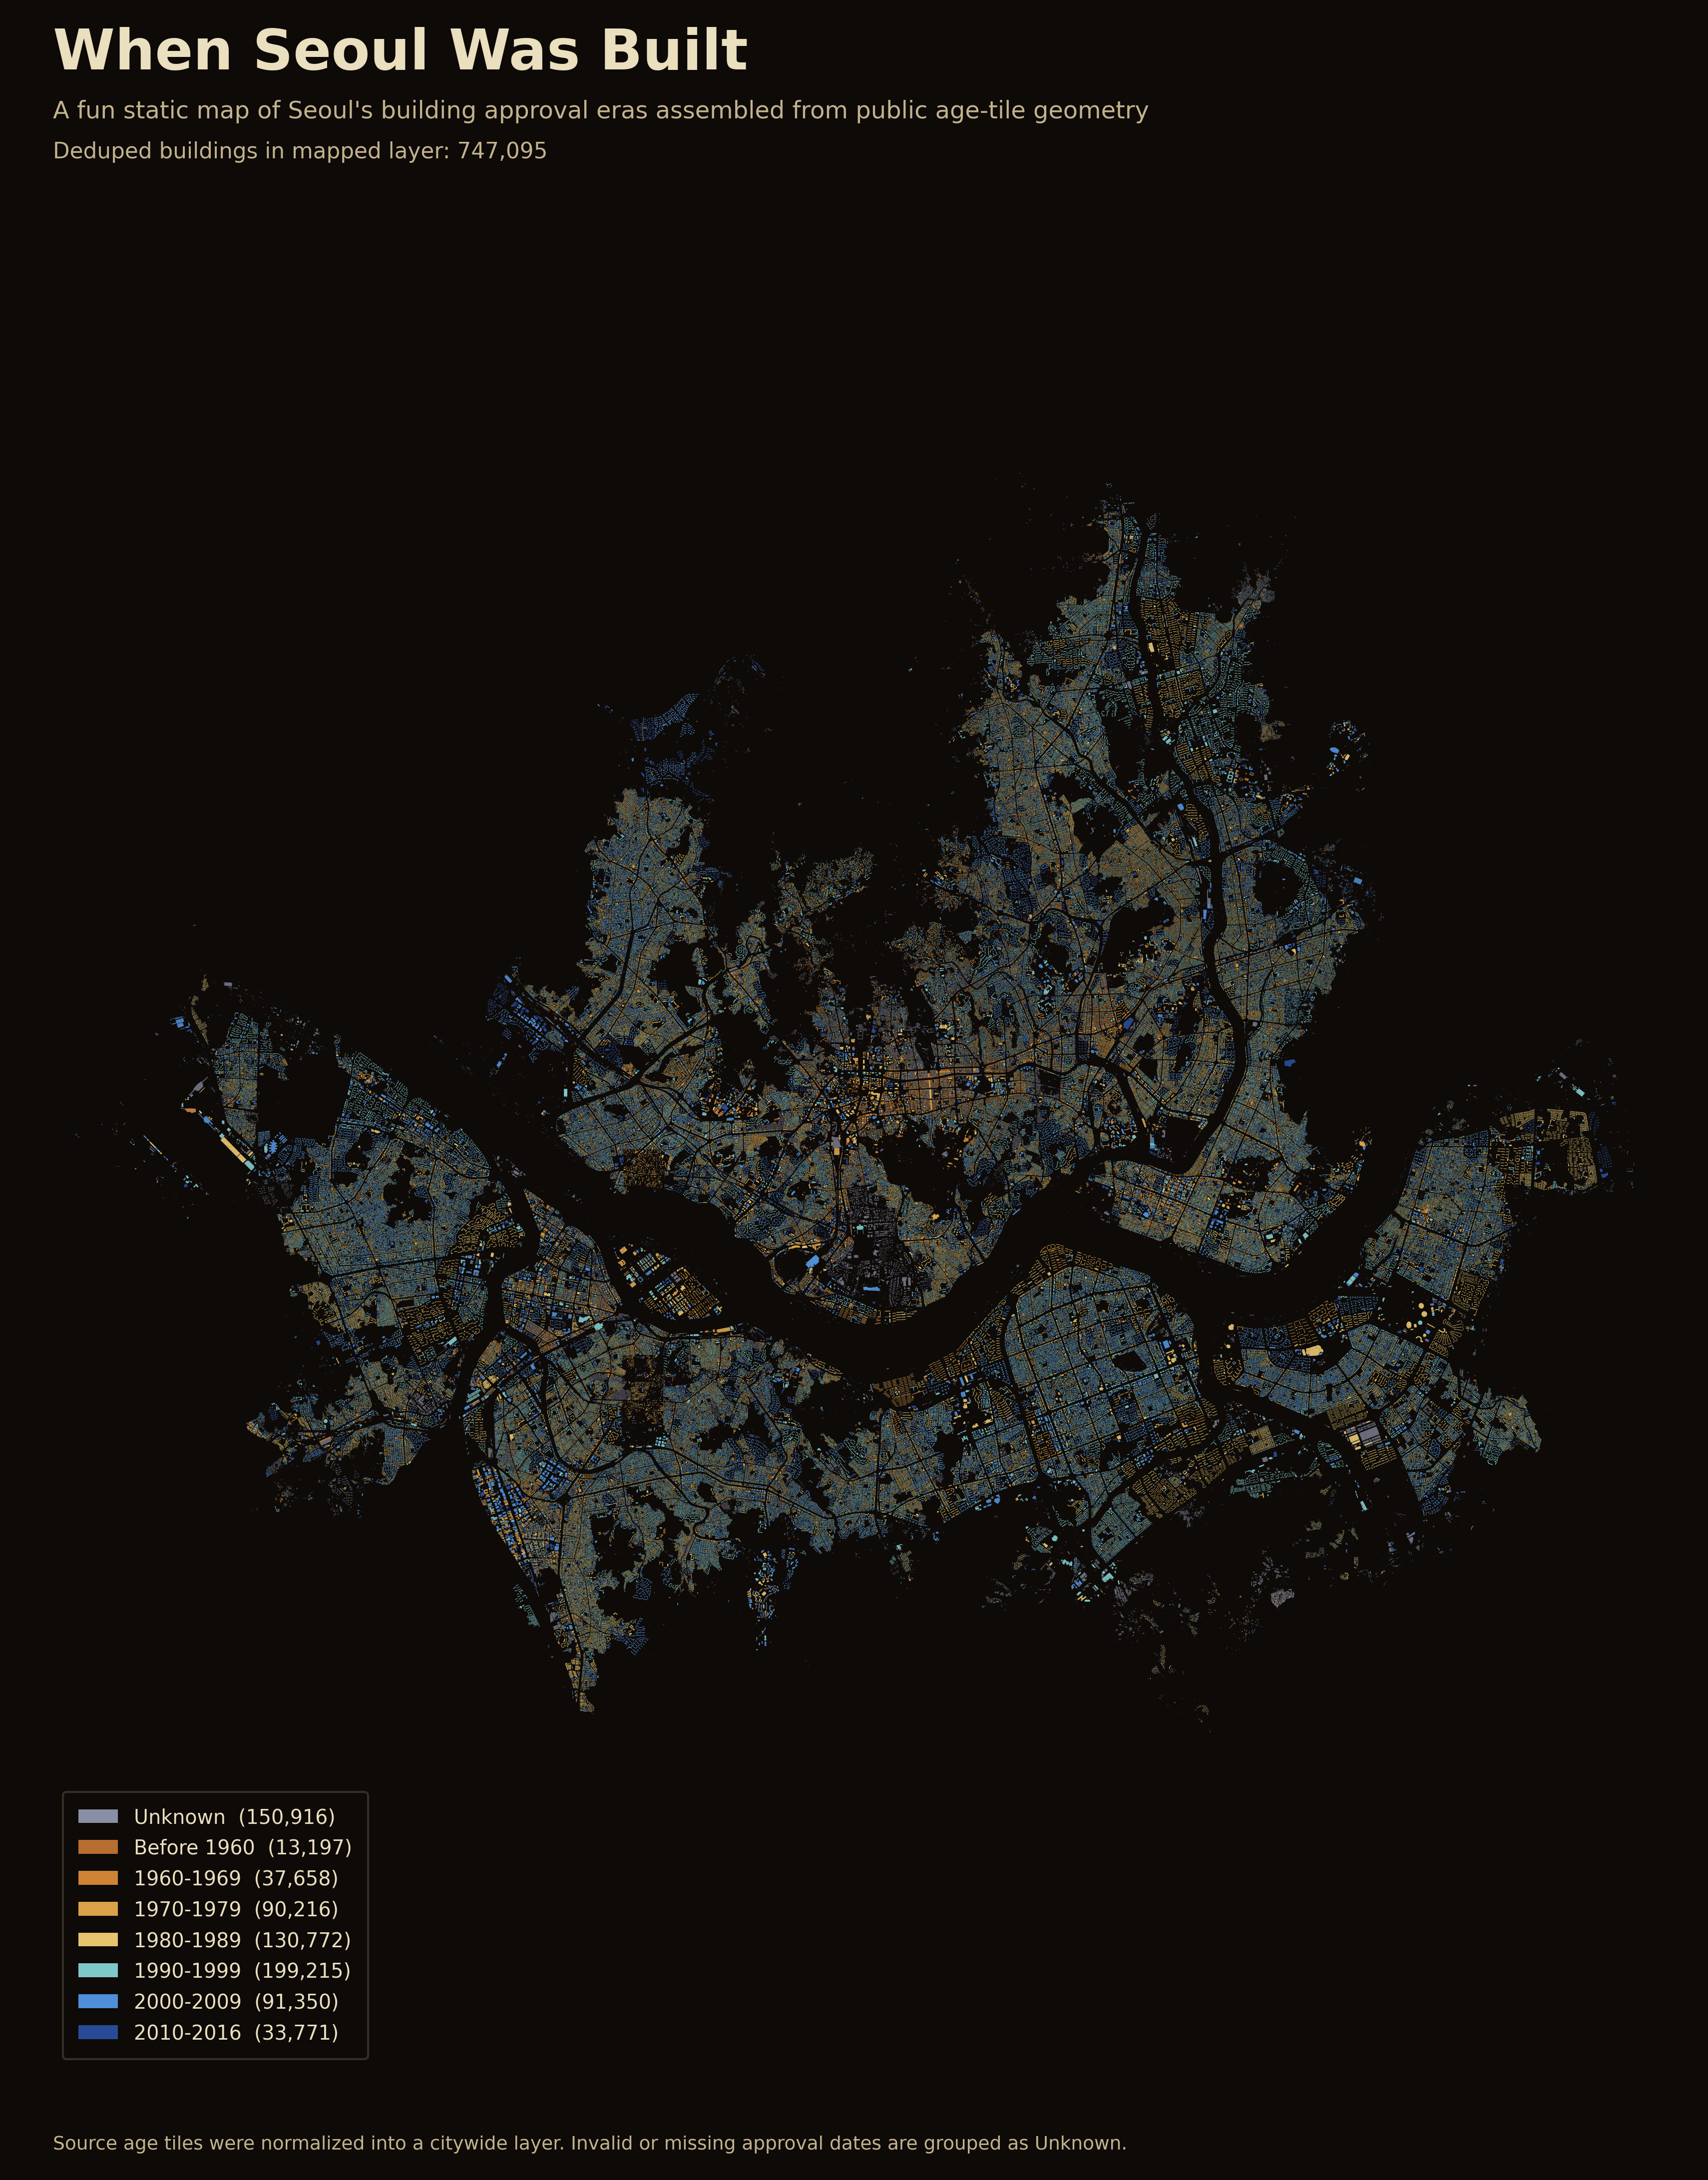
This map is designed as both a visual artifact and an analytical summary. It shows 747,095 deduplicated buildings in one layer, making it possible to compare broad development patterns across the city at a glance instead of reading the approval data only as a table.
Era Distribution
The processed age layer contains 747,095 deduplicated mapped features. The largest mapped era band is the 1990s, followed by unknown-date buildings, the 1980s, the 2000s, and the 1970s.

This distribution helps explain why the map has strong mid-to-late development colors. The 1990s and 1980s make up a large portion of the mapped features, while pre-1960 features are comparatively rare in the processed layer.
Source Buckets
The age layer is assembled from four public tile groups. Each group corresponds to a different approval-era range or unknown-date group.

This is important because the final visual depends on the source organization. The project does not force one raw file into a map; it normalizes multiple source buckets into one consistent temporal schema.
Takeaway
When Seoul Was Built is a geospatial data story about making urban time visible. The key work is not only making a map-like visual, but designing a reproducible pipeline that turns public age-tile geometry into defensible era bins.
Next improvements could include cleaner water and park masking, district-level summaries, and a larger report explaining how different parts of Seoul correspond to different development periods.