Debugging Vision Agents
Vision-language models are becoming very good at describing images, answering visual questions, reading charts, counting objects, and supporting multimodal workflows. But when a model gives an answer, the most important engineering question often comes after the answer:
Why did it say that?
If a Vision AI agent says there are three damaged buildings in a satellite image, did it actually focus on the damaged buildings? If it says the red car is on the left, did it inspect the car or guess from the prompt? If two models disagree, is one missing a visual detail, or are they using different assumptions about the task?
That is the motivation behind Vision Agent Debugger: a small but useful tool for making Vision AI behavior easier to inspect. The project combines a React frontend, a FastAPI backend, CLIP-based heatmap generation, multi-model comparison, reasoning-step extraction, error detection, and cost tracking.
It is not a complete interpretability research framework. It is something more practical: a debugging surface for people who build with vision models and want to see more than a final text response.
The Problem
Most Vision LLM interfaces hide the process. You upload an image, write a prompt, wait for a model, and receive an answer. That is fine for demos, but it is weak for development.
For real projects, especially remote sensing, public data dashboards, field monitoring, damage assessment, surveillance review, medical imaging support, and industrial inspection, we need to ask sharper questions:
- Did the model attend to the correct region?
- Did the prompt cause the model to focus on the wrong visual concept?
- Did two models disagree on the object, count, location, or conclusion?
- Did the model fail because of perception, reasoning, or API/configuration issues?
- How much did the analysis cost?
Debugging a vision agent means separating the final answer from the evidence path. The answer is only one artifact. A useful debugger should also expose visual focus, reasoning traces, model disagreement, and failure states.
What the Project Builds
Vision Agent Debugger gives a user three core workflows:
- Upload an image and prompt.
- Generate a visual heatmap for the image-prompt pair.
- Compare responses from multiple vision models side by side.
The backend exposes several endpoints:
/api/generate-heatmap: creates a heatmap from an image and prompt./api/analyze-image: runs selected models and returns responses, reasoning steps, errors, and cost./api/compare-models: compares Gemini, Claude, and GPT-4V-style responses./api/debug-agent: combines heatmap generation with model comparison.
The frontend wraps those outputs into a debugging interface: upload panel, prompt box, heatmap overlay, model comparison cards, reasoning step views, error warnings, and total cost display.
The stack is intentionally simple:
- React, Vite, Tailwind CSS, and Canvas-style visual overlay patterns on the frontend.
- FastAPI on the backend.
- CLIP for image-text representation.
- Gemini, Claude, and OpenAI-compatible vision calls for multi-model analysis.
This is a good architecture for a prototype because each part has a clear job. The frontend does interaction and presentation. The backend does model orchestration. CLIP creates a visual explanation signal. The model analyzer standardizes responses into a comparable format.
A Small Example
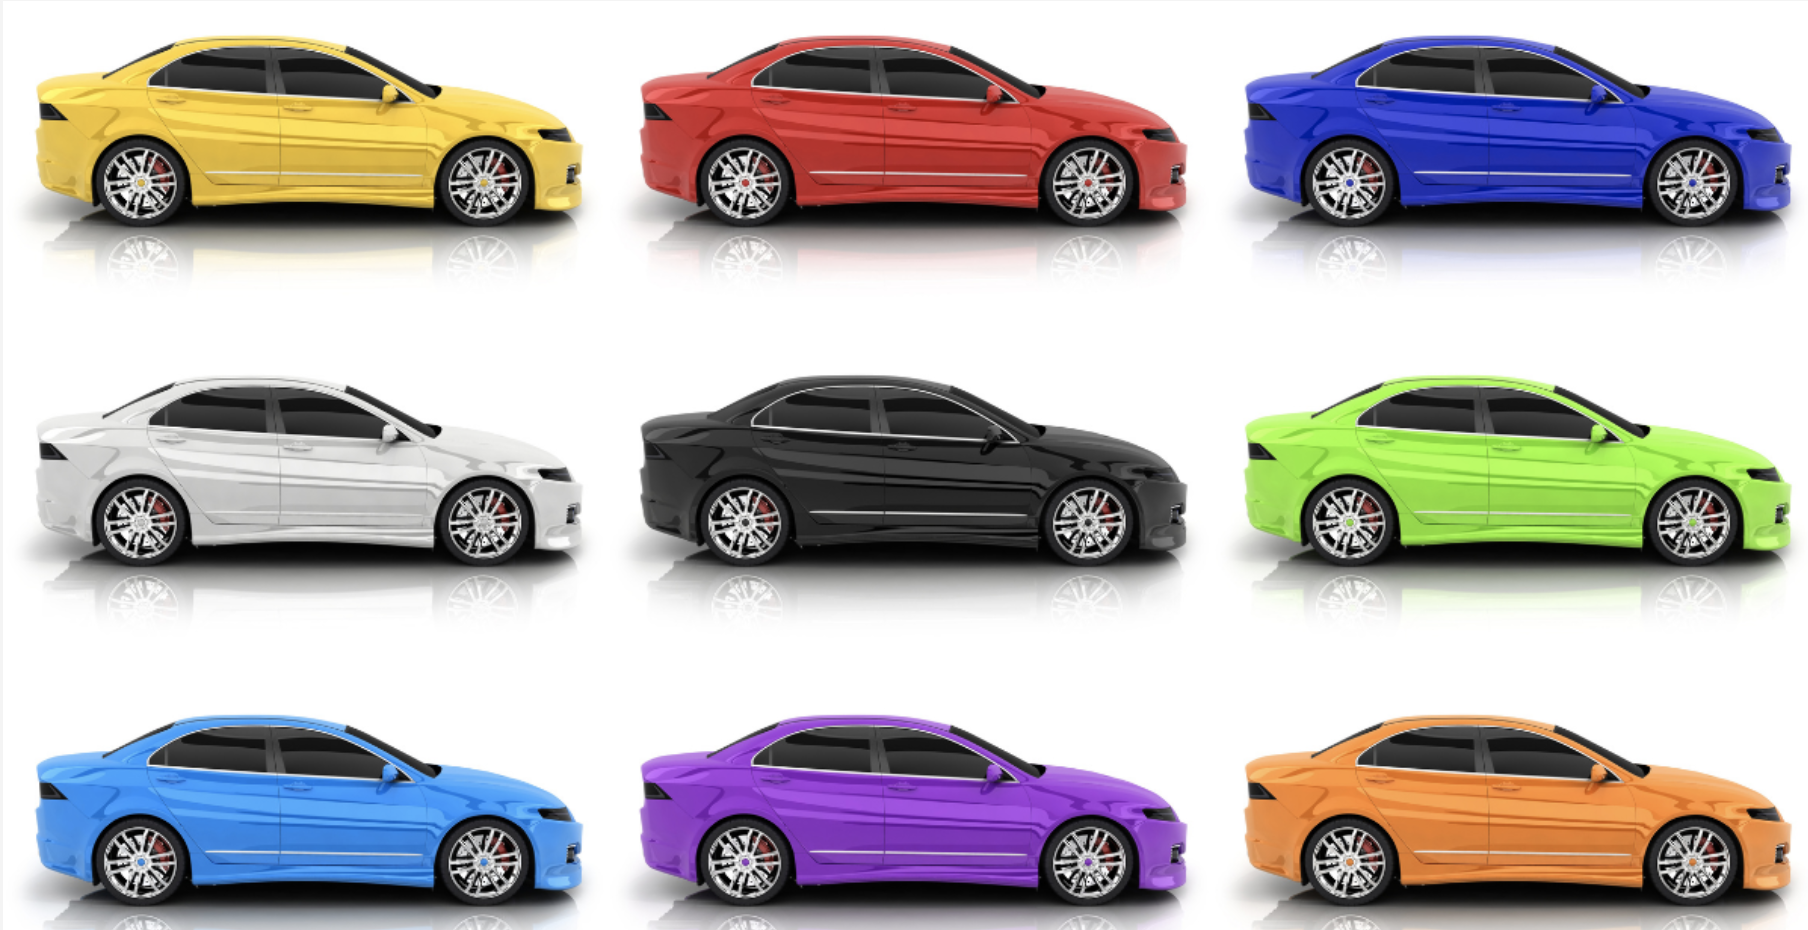
The repository includes a test image with multiple cars in different colors. A prompt might ask something like:
Which cars are visible in the image?
or:
Count the red cars.
The original image is simple, but that is useful for debugging because the expected answer is visually obvious.
The heatmap output gives a spatial debugging layer. In the current prototype, it is a smooth visual approximation of where the system is emphasizing the image-prompt relationship.
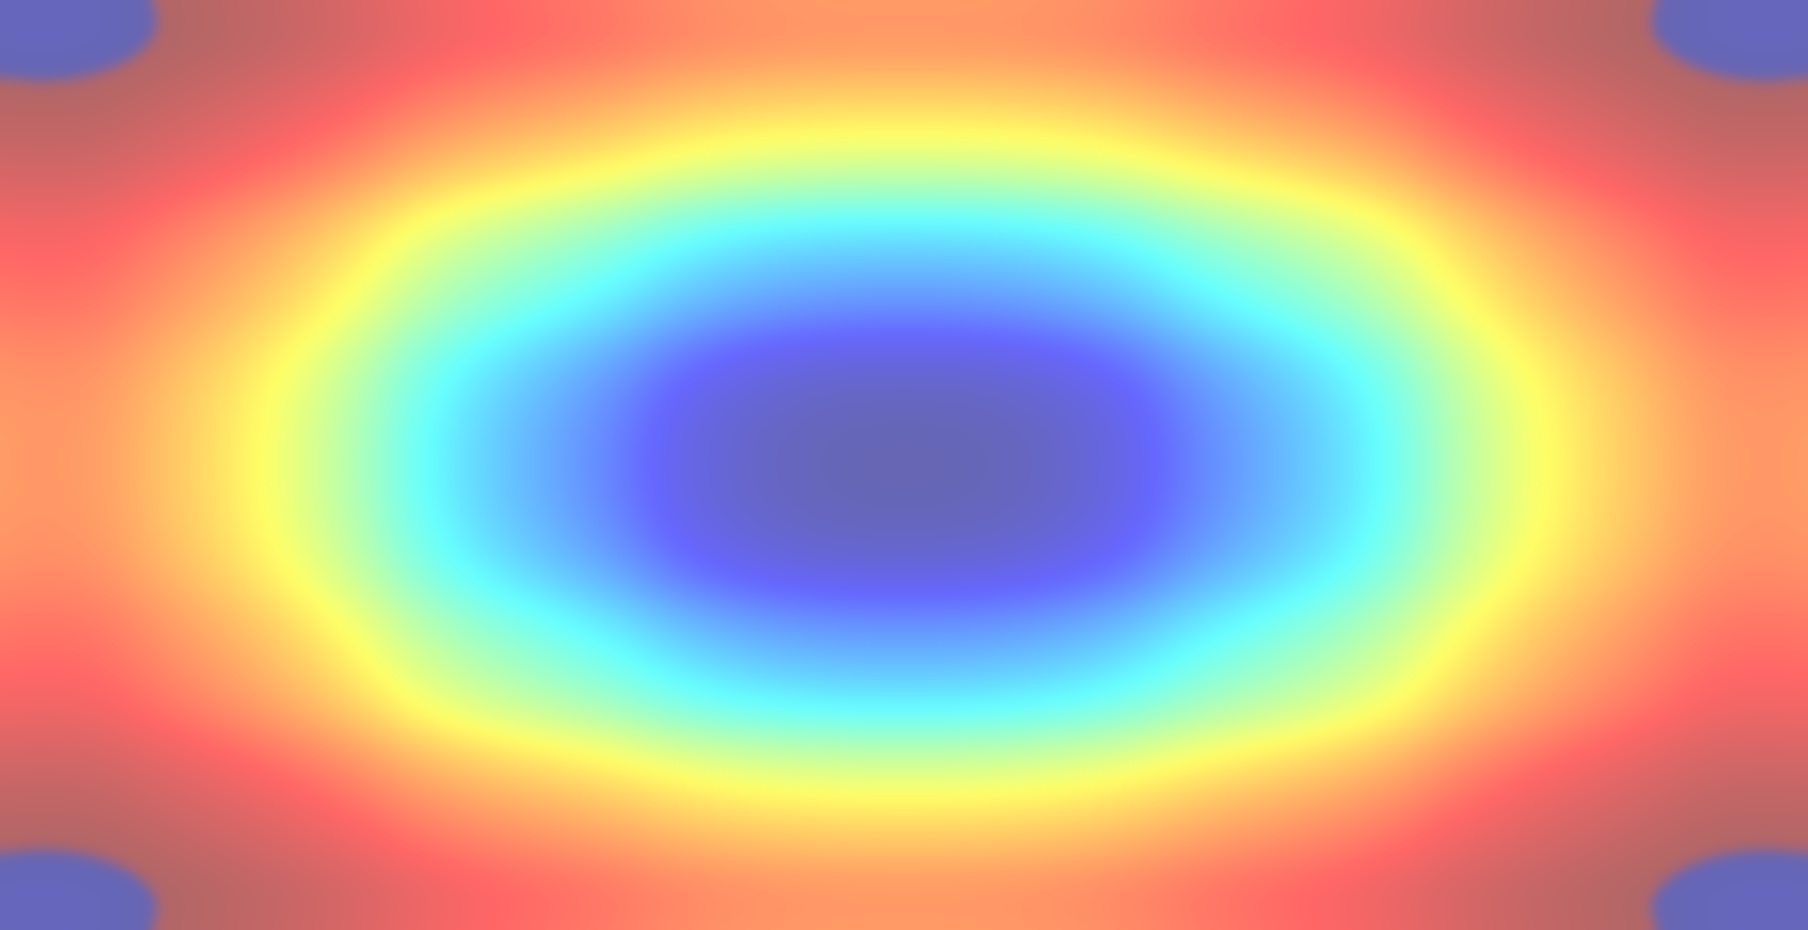
This kind of image is not a final scientific explanation by itself. But as a developer tool, it is useful because it makes the debugging conversation more concrete. Instead of only asking “was the answer correct?”, we can ask “does the visual evidence look aligned with the task?”
The Math Behind the Heatmap
A vision-language debugger needs some way to connect text to image regions. CLIP gives us a useful starting point because it maps images and text into a shared embedding space.
Let an image be $I$, and let the prompt be $t$. CLIP has an image encoder $f_I$ and a text encoder $f_T$:
\[z_I = f_I(I), \qquad z_T = f_T(t)\]Both embeddings are usually normalized:
\[\hat{z}_I = \frac{z_I}{\|z_I\|_2}, \qquad \hat{z}_T = \frac{z_T}{\|z_T\|_2}\]The image-text similarity can be measured using cosine similarity:
\[s(I,t) = \hat{z}_I^\top \hat{z}_T\]That gives one global score. But a heatmap needs spatial scores. For a Vision Transformer such as CLIP ViT-B/32, the image is divided into patches. With a 224 by 224 image and a patch size of 32, we get a 7 by 7 grid:
\[N = 7 \times 7 = 49\]Ideally, each patch has an embedding $p_i$. A prompt-aware patch score can be written as:
\[a_i = \frac{\exp(\tau \cdot \hat{p}_i^\top \hat{z}_T)} {\sum_{j=1}^{N} \exp(\tau \cdot \hat{p}_j^\top \hat{z}_T)}\]Here, $a_i$ is the attention-like weight for patch $i$, and $\tau$ is a temperature parameter that controls how sharp the distribution becomes.
After computing patch scores, we can reshape them into a 7 by 7 map:
\[A = \text{reshape}(a_1,\ldots,a_{49})\]Then we normalize the map:
\[M = \frac{A - \min(A)}{\max(A) - \min(A) + \epsilon}\]Finally, we resize $M$ to the original image size, convert it into a color map, and overlay it on the image:
\[O = (1-\alpha)I + \alpha C(M)\]where $C(M)$ is the colored heatmap and $\alpha$ is the overlay opacity.
That is the clean mathematical version. The current repository implementation is an early engineering approximation: it uses CLIP embeddings and generates a smoothed spatial map rather than extracting full transformer patch attention end to end. That is okay for a prototype, but it is important to say clearly. A production research version should replace the approximation with patch-level CLIP similarity, attention rollout, Grad-CAM-style gradients, or segmentation-aware region scoring.
The important idea is still the same: the debugger turns a hidden image-text relationship into a visible spatial artifact.
Model Comparison as a Debugging Tool
Heatmaps help with visual focus, but they do not solve the whole problem. Vision agents also fail through reasoning, phrasing, counting, ambiguity, or hallucination.
That is why the project includes multi-model comparison.
For each model $m$, the debugger stores a response object:
\[R_m = (y_m, S_m, e_m, c_m)\]where:
- $y_m$ is the model answer.
- $S_m$ is the extracted reasoning-step list.
- $e_m$ is the error state.
- $c_m$ is the estimated cost.
Once all models return, the tool can compare them:
\[\mathcal{R} = \{R_{\text{Gemini}}, R_{\text{Claude}}, R_{\text{GPT}}\}\]The current implementation checks API failures and simple contradiction patterns. For example, if one model says an object is visible and another says no object is present, that disagreement becomes a warning.
This is simple, but the workflow is powerful. A disagreement is often the most useful signal during debugging. If three models agree, the answer may still be wrong, but confidence rises. If one model disagrees strongly, the user knows where to inspect.
Future versions could make this much stronger by using semantic entailment:
\[d_{ij} = 1 - \cos(g(y_i), g(y_j))\]where $g(\cdot)$ is a sentence embedding model. Large disagreement scores could trigger deeper review, especially for high-stakes visual tasks.
Reasoning Steps
The debugger also extracts reasoning steps from model responses. It looks for numbered lists, bullet points, or sentence structure, then turns the output into a sequence:
\[S_m = [s_1, s_2, \ldots, s_k]\]This does not reveal the model’s true internal reasoning. It reveals the explanation the model produced. That distinction matters. But even explanation traces are useful when debugging prompts and workflows.
For example, suppose a model answers a counting task incorrectly. The extracted steps may show whether it:
- described the image generally,
- identified the correct object type,
- confused color or position,
- skipped occluded instances,
- or made a counting error at the end.
That helps the developer decide what to fix. The prompt might need more constraints. The image might need cropping. The model might need a better visual grounding step before reasoning.
Error Detection
The project’s error detector handles two practical cases:
- API errors, such as missing keys or failed model calls.
- Contradictions between model responses.
This may sound small, but it is a useful engineering layer. In multimodal apps, the failure mode is often not “the model is bad.” Sometimes the API key is missing. Sometimes one provider returns an error. Sometimes the frontend shows an incomplete response. Sometimes cost or token limits change behavior.
By making errors visible, the tool turns silent failure into an inspectable state.
Cost Tracking
Cost is part of debugging too. If a system calls three large vision models every time a user uploads an image, the workflow may become expensive quickly.
The debugger estimates cost per model and total cost:
\[C_{\text{total}} = \sum_{m \in \mathcal{M}} c_m\]This makes it easier to compare accuracy, latency, and cost together. A cheap model may be enough for broad image descriptions. A stronger model may be worth the price for detailed visual reasoning. A debugger should help the developer see those tradeoffs directly.
What I Like About This Project
The strongest part of Vision Agent Debugger is not that each component is perfect. It is that the project has the right shape.
A good Vision AI debugging tool should combine four views:
- what the image contains,
- where the model may be looking,
- what the model says,
- and how different models disagree.
This repo already has those pieces. It is easy to imagine extending it into a stronger research or production tool.
For example:
- Replace the current heatmap approximation with patch-level CLIP similarity.
- Add bounding-box or segmentation overlays.
- Add prompt version tracking.
- Add semantic disagreement scoring across model outputs.
- Add task-specific metrics for counting, detection, chart reading, or remote sensing.
- Save debug sessions so users can compare failures over time.
- Add side-by-side original, heatmap, model answer, and ground-truth annotation.
For remote sensing, the same idea becomes even more interesting. A user could upload a flood image, satellite crop, or urban change pair and ask: did the model focus on the flooded area, the changed buildings, the roads, or the irrelevant background?
That is where debugging becomes research infrastructure.
Conclusion
Vision agents should not be treated as magic boxes. If they are going to help with real visual decisions, we need tools that expose where they looked, what they answered, how they explained themselves, where they failed, and how much the process cost.
Vision Agent Debugger is a practical first step in that direction. It combines CLIP heatmaps, model comparison, reasoning traces, error detection, and cost tracking into one workflow. It is honest as a prototype and useful as a foundation.
The next step is to make the visual explanations more faithful and the disagreement detection more semantic. But even now, the project points in the right direction: Vision AI systems become more useful when their behavior can be inspected.
You can read the code, run the app, and fork the project here: